

在闲逛各博客的时候,发现有些功能蛮有意思的,于是趁现在还没忙碌起来,跟着抄了下作业,同时通过 AI 的帮忙,优化了下以适应自己页面的风格。
博文热力图
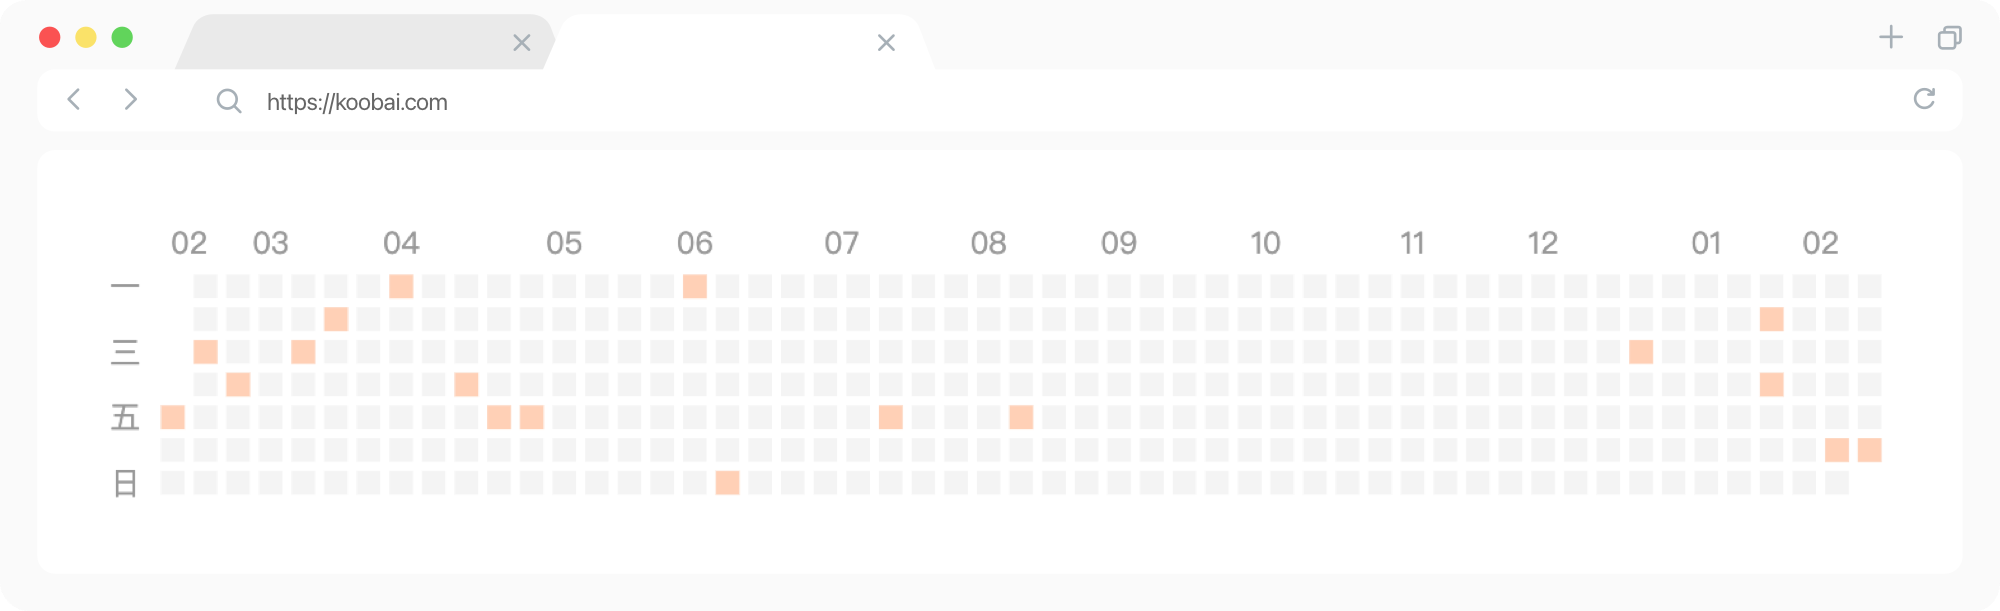
最开始看到好像是因为 木木老师发了个memos,当时想着自己平常也不怎么更新博文,所以意义不大。这两天又在 椒盐豆豉中看到完整的教程,心想这次页面布局改成很窄的单栏之后,似乎很契合小而美的特性。一顿操作,跟原版的区别在于:
- 增加了支持暗黑模式。
- 删除了字数统计,及根据字数多少显示色块的深浅。
- 简化星期及月份的显示。
- 一周的开始,从周日改成周一。
- 在 Echarts 官网重新定制了 JS 功能,不然原版的有 1M 多。
<div id="heatmap" style="max-width: 700px;height: 110px;margin-bottom: 40px;"></div>
<script src="https://img.koobai.com/echarts.min.js"></script>
<script type="text/javascript">
  var chartDom = document.getElementById('heatmap');
  var myChart = echarts.init(chartDom);
  window.onresize = function() {
      myChart.resize();
  };
  var option;
  var dataMap = new Map();
  {{ range ((where .Site.RegularPages "Type" "posts")) }}
    var key = {{ .Date.Format "2006-01-02" }};
    var value = dataMap.get(key);
    var link = {{ .RelPermalink}};
    var title = {{ .Title }};

    // multiple posts in same day
    if (value == null) {
      dataMap.set(key, [{link, title}]);
    } else {
      value.push({link, title});
    }
  {{- end -}}

  var data = [];
  for (const [key, value] of dataMap.entries()) {
    data.push([key, value.length]);
  }

  var startDate = new Date();
  var year_Mill = startDate.setFullYear((startDate.getFullYear() - 1));
  var startDate = +new Date(year_Mill);
  var endDate = +new Date();

  startDate = echarts.format.formatTime('yyyy-MM-dd', startDate);
  endDate = echarts.format.formatTime('yyyy-MM-dd', endDate);

  // 检测浏览器主题模式并选择颜色方案
  var prefersDarkMode = window.matchMedia && window.matchMedia('(prefers-color-scheme: dark)').matches;

  // 定义明亮模式下的颜色方案
  var lightTheme = {
      backgroundColor: '#FFFFFF',
      fangkuaicolor:'#F4F4F4',
      gaoliangcolor: ['#ffd0b6'],
      riqiColor: '#999',
      textbrcolor: '#FFF',
      xiankuangcolor:'rgba(0, 0, 0, 0.0)',
  };

  // 定义暗黑模式下的颜色方案
  var darkTheme = {
      backgroundColor: '#1A1718',
      fangkuaicolor:'#282325',
      gaoliangcolor: ['#b25f2f'],
      riqiColor: '#666',
      textbrcolor: '#332D2F',
      xiankuangcolor:'rgba(0, 0, 0, 0.0)',
  };

  // 根据浏览器主题模式选择当前主题
  var currentTheme = prefersDarkMode ? darkTheme : lightTheme;

  option = {
    tooltip: {
    hideDelay: 1000,
    enterable: true,
    backgroundColor: currentTheme.textbrcolor,
    borderWidth: 0, // 边框宽度为0
    formatter: function (p) {
        const date = p.data[0];
        const posts = dataMap.get(date);
        var content = `<span style="font-size: 0.75rem;font-family: var(--font-family-code);">${date}</span>`;
        for (const [i, post] of posts.entries()) {
            content += "<br>";
            var link = post.link;
            var title = post.title;
            content += `<a href="${link}" target="_blank">${title}</a>` + '<br>';
        }
        return content;
        }
    },
    visualMap: {
        show: false,
        inRange: {
          color: currentTheme.gaoliangcolor
        },
    },
    calendar: {
        left: 20,
        top:20,
        bottom:0,
        right: 0,
        cellSize: ['auto', 13],
        range: [startDate, endDate],
        itemStyle: {
            color: currentTheme.fangkuaicolor,
            borderWidth: 3.5,
            borderColor: currentTheme.backgroundColor,
        },
        yearLabel: { show: false },
        monthLabel: {
        nameMap: ['01', '02', '03', '04', '05', '06', '07', '08', '09', '10', '11', '12'],
        textStyle: {
            color: currentTheme.riqiColor,
        }
    },
        dayLabel: {
            firstDay: 1,
            nameMap: ['日', '一', '', '三', '', '五', ''],
            textStyle: {
                color: currentTheme.riqiColor
            }
        },
        splitLine: {
            lineStyle: {
                color: currentTheme.xiankuangcolor,
            }
        }
    },
    series: {
        type: 'heatmap',
        coordinateSystem: 'calendar',
        data: data,
    }
  };

  myChart.setOption(option);
  myChart.on('click', function(params) {
    if (params.componentType === 'series') {
      // open the first post on the day
      const post = dataMap.get(params.data[0])[0];
      const link = window.location.origin + post.link;
      window.open(link, '_blank').focus();
    }
});
</script>
详情页段落目录导航
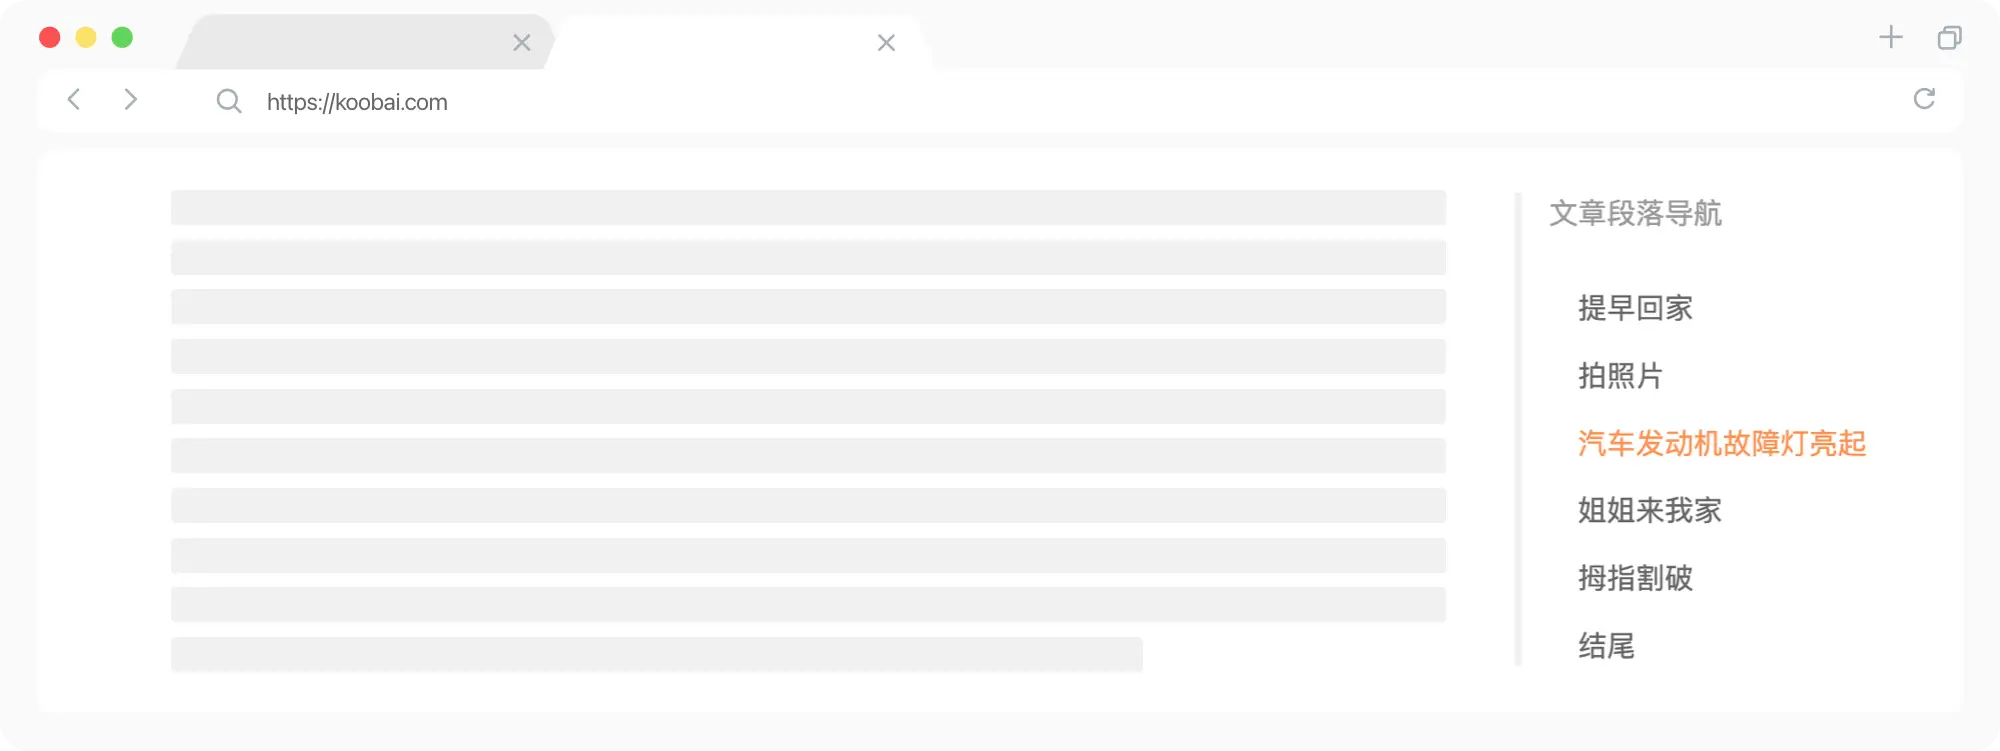
这个功能早在去年重新折腾博客的时候就想增加,但当时因为不大会,搞得都不完美,所以也就不了了之。这几天在 atpX中,看到文章目录滚动高亮教程,于是又试着折腾了下。经过跟 AI 的配合,完美显示,不过过程还是碰到问题:
1. 显示位置
如果直接使用 position: fixed; 特性,目录位置只会根据浏览器窗口的大小来改变。这就会导致,浏览器窗口很大,主内容跟目录就会分得很开;浏览器窗口小,主内容跟目录有可能就会重叠。尝试了各种解决方法之后,决定在最上层的父元素中使用display: flex;。然后在目录的上一级再加入一个父元素div,完美解决。
<div class="single-nrong">
<div class="single-zw">主内容</div>
<div>
    <div class="paragraph-dh">文章段落目录导航</div>
</div>
</div>
<style>
.single-nrong {display: flex;}
.single-zw {width: 100%;}
.paragraph-dh {position: fixed;}
</style>
2. 无目录导航
文章页如果没有目录导航,也会显示内容标题,这就看着很奇怪了。解决方法:
  {{ $toc := .TableOfContents }}
  <!--判断<li>标签中有没有内容,如果有内容就显示,无内容就隐藏-->
  {{ if findRE "<li>" $toc 1 }}
    <div class="paragraph-dh">
      <div class="sidebar-biaot">文章段落导航</div>
      {{ $toc }}
    </div>
  {{ end }}
3. 完整方案
特性:1. 默认隐藏,滑动到一定距离显示。2. 滑动到页面上方 1/4 处高亮显示当前目录。3. 点击目录导航平滑滚动到对应的标题。4. 无目录导航的文章页不显示。
- 新建 js 文件,如 single.js。
document.addEventListener("DOMContentLoaded", () => {
    const postTOC = document.querySelector('.paragraph-dh');

    const headingObserver = new IntersectionObserver(headings => {
        headings.forEach(({ target, isIntersecting }) => {
            const link = postTOC.querySelector(`a[href="#${target.id}"]`);
            if (isIntersecting && link) {
                postTOC.querySelectorAll('a').forEach(a => a.classList.remove('active'));
                link.classList.add('active');
            }
        });
    }, { rootMargin: '0px 0px -75%' });

    document.querySelectorAll('.content h2[id], .content h3[id]').forEach(heading => headingObserver.observe(heading));

    window.addEventListener('scroll', () => postTOC.style.opacity = (window.pageYOffset > 400) ? 1 : 0);

    postTOC.addEventListener('click', (e) => {
        e.preventDefault();
        const targetElement = document.getElementById(e.target.getAttribute('href').substring(1));
        if (targetElement) targetElement.scrollIntoView({ behavior: 'smooth' });
    });
});
- 在 single.html 文件合适的位置中添加:
<div class="single-nrong">
<div class="single-zw">
   文章内容
</div>
<div>
  {{ $toc := .TableOfContents }}
  {{ if findRE "<li>" $toc 1 }}
    <div class="paragraph-dh">
      <div class="sidebar-biaot">文章段落导航</div>
      {{ $toc }}
    </div>
  {{ end }}
</div>
</div>
<script src="/js/single.js"></script>
- 在 css 文件中添加:
.single-nrong{
  display: flex;
}
.single-zw{
  width: 100%;
}
.paragraph-dh {
   display: none;
  @include breakpoint('large') {
    display: block;
    position: fixed;
    opacity: 0;
    top: 70px;
    margin-left: 40px;
    transition: opacity 0.5s ease;
    border-left: 4px solid #f0f0f0;
    padding: 0 15px;
    max-width: 300px;
  }
}
.paragraph-dh a{
  line-height: 1.4;
  color: #666;
}
.paragraph-dh ul{
  gap: 15px;
  display: grid;
}
.paragraph-dh ul ul {
  padding-inline-start: 1rem;
  margin-top: 10px;
}
.paragraph-dh a.active {
  color: var(--text-highlight-color);
  transition: all .25s ease-in-out;
}
结语
现在折腾博客是完全离不开各类 AI 协助了,让一个不懂技术的人也能瞎折腾。这几次折腾的时候发现 coze 非常好用,基本上一次就能给出正确答案。看来 ChatGPT 4.0 就是牛逼。